


Prepared Exclusively for the Ownership of 1114 S Sherbourne Dr
A Co-Listing of the LAAA Team · Marcus & Millichap & Coldwell Banker Global Luxury · July 2026

Since 2011, the LAAA Team has closed 460+ multifamily transactions totaling $1.47B+ in volume across Los Angeles, Ventura, and Santa Barbara counties, with deep, continuous transaction experience in the Westside-adjacent rental corridors of Beverlywood, Pico-Robertson, Mid-City, and Beverly Grove that surround 1114 S Sherbourne Dr.
Our practice is built on disciplined underwriting, the deepest comparable-sales dataset in the submarket, and a marketing engine that reaches every active multifamily buyer in Los Angeles. For this offering, the LAAA Team is joined by Vangelis Korasidis of Coldwell Banker Global Luxury — a top-1% international agent based in Beverly Hills — combining institutional multifamily execution with a global luxury buyer network.
For 1114 S Sherbourne Dr, that means an evidence-based opinion of value anchored in current in-place income, a clear rent-controlled mark-to-market story, and recent Westside small-apartment sales — presented with the same rigor we would bring to defending the price against a buyer's due-diligence challenge.


• Chairman's Club - Marcus & Millichap's top-tier annual honor
• National Achievement Award - multiple years, both partners
• #1 Most Active Multifamily Team in LA County - CoStar 2019-2021
• Sales Recognition Award - every year since 2016
• 40+ transactions per year - one of SoCal's most active groups
1114 S Sherbourne Dr is a 7-unit walk-up apartment building in a prime Westside-adjacent rental corridor, positioned just south of Olympic Boulevard between Robertson and La Cienega in the Beverlywood / Pico-Robertson pocket of Los Angeles (90035). The unit mix is a favorable blend of four one-bedroom and three two-bedroom homes over gated carport parking.
The property has been meaningfully de-risked by recent ownership: four of the seven unit interiors have been renovated, the building received fresh exterior paint in 2024, and a new roof was installed in 2024 — materially reducing near-term capital exposure for a buyer. Four of the seven units have turned to market rents since January 2026, proving out achievable rent levels.
The core of the opportunity is a durable, in-place rent-controlled (LARSO) income stream of $188,796 today, with a clear mark-to-market path: two long-tenured units remain roughly $1,000–$1,350/month below market, and full stabilization lifts gross scheduled rent to approximately $237,600 — a ~26% embedded upside that carries the going-in cap from the high-4% range toward the high-6% range.

1114 S Sherbourne Dr sits in one of central Los Angeles's most established and supply-constrained rental corridors — the Beverlywood / Pico-Robertson pocket just south of Olympic Boulevard, between Robertson and La Cienega. The area blends single-family character with pockets of well-tenanted small apartment product and draws consistent renter demand from its unmatched access to Westside employment.
Residents are within minutes of the job and lifestyle hubs of Beverly Hills, Century City, Culver City, and West Hollywood, and a short drive to Cedars-Sinai Medical Center. The Pico, Olympic, and Robertson corridors provide dense neighborhood retail, cafes, grocery, and houses of worship, while quick connections to the 10 Freeway tie the location to the greater Westside and Downtown.
Limited nearby multifamily development and a deep, credit-worthy renter base underpin low vacancy and steady long-term rent growth — the fundamentals that make the Westside a perennial target for private and 1031 exchange capital.
| Location Details | |
|---|---|
| Submarket | Beverlywood / Pico-Robertson |
| ZIP | 90035 (MLS Area 9) |
| Cross Streets | S of Olympic, btwn Robertson & La Cienega |
| Major Employment | Beverly Hills, Century City, Cedars-Sinai |
| Retail Corridors | Pico Blvd, Robertson Blvd, Olympic Blvd |
| Freeway Access | I-10 (Robertson / La Cienega on-ramps) |
| Zoning | LAR3 |
| Rent Control | City of LA RSO (LARSO) |

| Property Overview | |
|---|---|
| Units | 7 (4x 1BR + 3x 2BR) |
| Year Built | 1955 |
| Building SF | 6,278 (vendor) |
| Rentable SF | ~6,060 (per rent roll) |
| Stories | 2 over parking |
| Condition | 4 of 7 interiors renovated |
| Site & Zoning | |
|---|---|
| APN | 4332-023-003 |
| Lot Size | 6,400 SF (0.147 ac) |
| Zoning | LAR3 |
| Parking | Carport (per MLS: 10 spaces) |
| Buildings | 1 |
| MLS # | 26831037 (prior, canceled) |
| Building Systems | |
|---|---|
| Roof | New (2024) |
| Exterior Paint | Refreshed (2024) |
| Heating | Wall units |
| Cooling | None / wall A/C (per unit) |
| Laundry | Common (laundry income) |
| Appliances | Range/oven, refrigerator |
| Regulatory & Utilities | |
|---|---|
| Rent Control (RSO) | Yes - City of LA (1955 build) |
| AB1482 | Superseded by RSO |
| Owner Pays | Water/sewer, trash, gas (common), gardening |
| Tenant Pays | Electric, in-unit gas |
| Registration | LAHD / SCEP (RSO) |
| Occupancy | 6 of 7 leased (85.7%) |
1031 Exchange Buyers
Westside-focused exchange buyers seeking a stable, land-rich RSO asset with in-place income and a defined mark-to-market path in a location that rarely trades.
Private Local Westside Investors
Long-hold owners who value the Beverlywood / Pico-Robertson address, the recent roof/paint/interior capital, and the durability of RSO cash flow through cycles.
Value-Add / Mark-to-Market Buyers
Investors underwriting the two remaining below-market units and future RSO-allowable increases to drive the yield from the high-4% range toward the high-6% range over the hold.
The combination of a trophy-adjacent Westside location, recent capital already spent, and a proven mark-to-market thesis broadens the buyer pool from pure yield buyers to location-and-appreciation buyers alike.
"It's rent-controlled - the upside is capped."
Four of seven units already turned to market between January and June 2026 at $2,395–$3,068, proving the market rents are real. Two long-tenured units remain ~$1,000–$1,350/mo below market - roughly $49,000/yr of embedded upside captured on natural turnover, plus annual RSO-allowable increases.
"The reported expenses look low - no taxes shown."
Correct - the seller's Chase operating statements carry no property tax (a low Prop-13 basis) and no management. Our underwriting reassesses taxes at 1.25% of price and adds a 4% management line, so the ~4.9% going-in cap is on a fully-loaded, reassessed basis.
"It's a 1955 building - what about deferred capital?"
The two largest near-term capital items are already handled: a new roof (2024) and fresh exterior paint (2024), with four unit interiors renovated. That materially lowers a buyer's first-five-year capital reserve versus comparable unrenovated vintage stock.
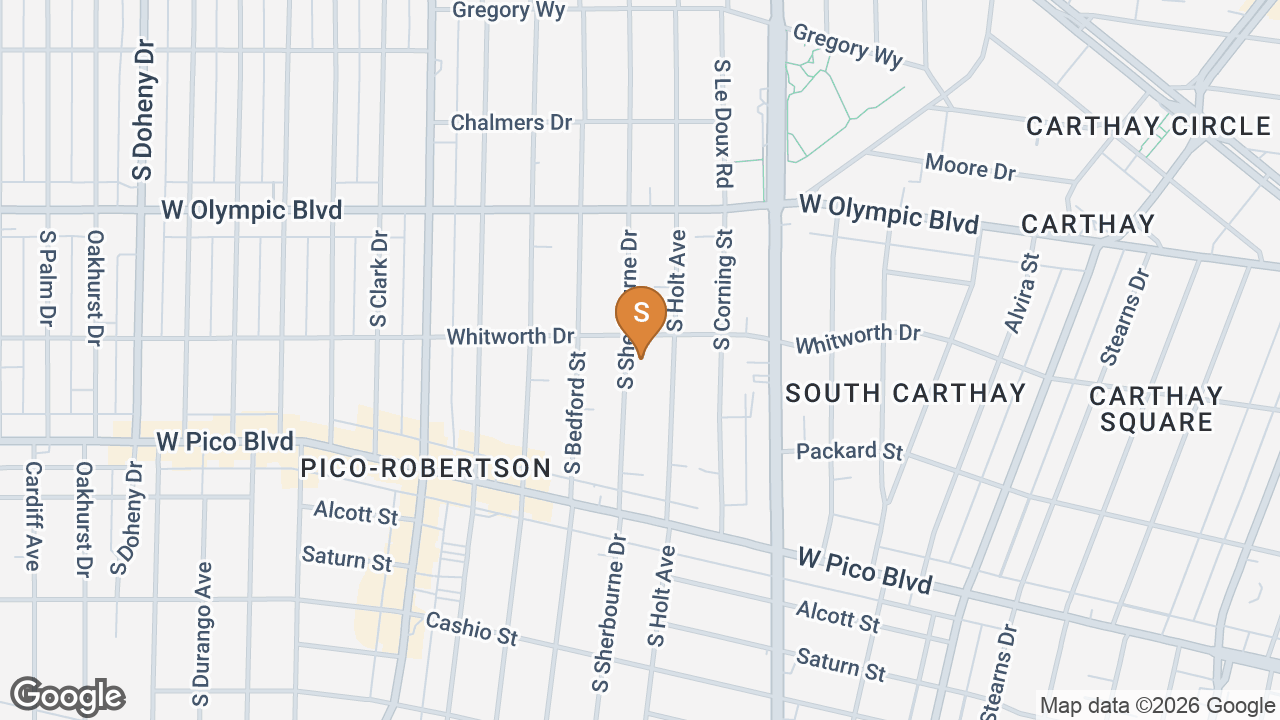
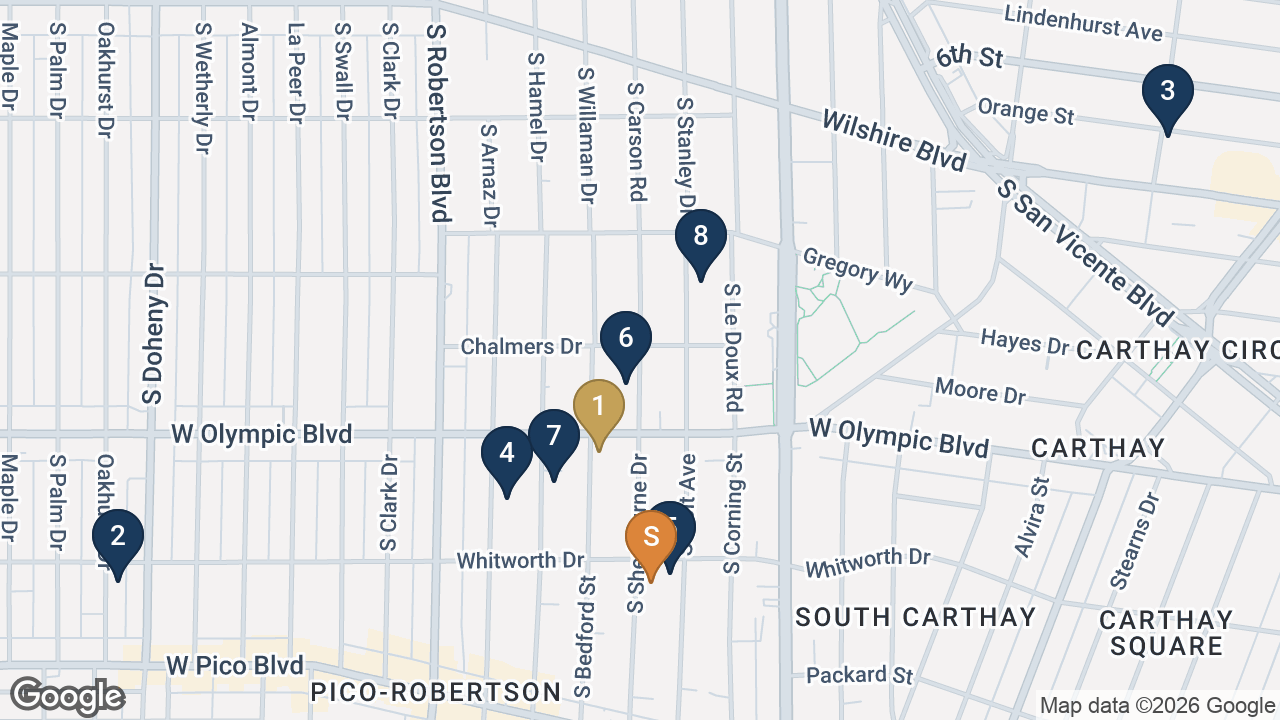
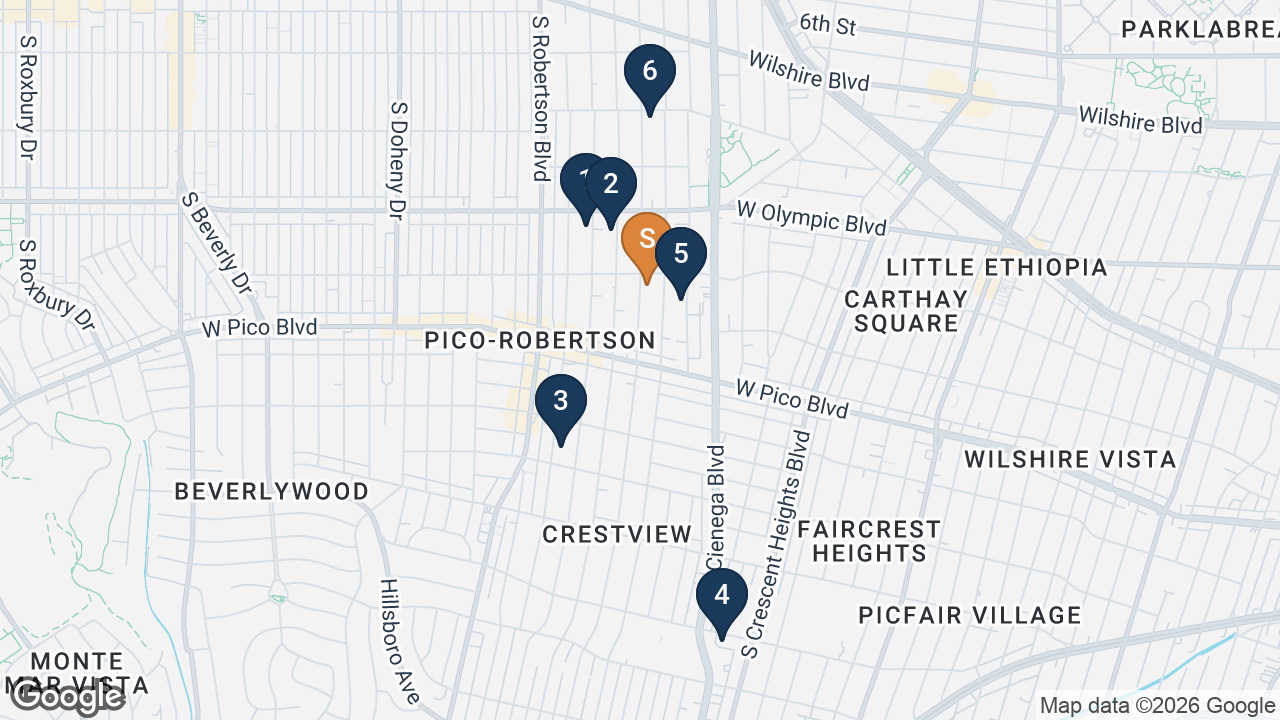
Comparable set drawn from the LAAA Team's own Marcus & Millichap sale of 1010 S Bedford St and its underwritten sold-comp file for the immediate submarket. Several comps sit within blocks of the subject — including 919 S Sherbourne Dr, on the same street.

| Address | Submarket | Yr | Units | Sale Price | $/Unit | $/SF | Cap | Close |
|---|---|---|---|---|---|---|---|---|
| 1. 1010 S Bedford St JUST CLOSED · LAAA TEAM | Pico-Robertson | 1963 | 12 | $3,650,000 | $304,167 | $283 | 5.16% | 2026 |
| 2. 1110 S Oakhurst Dr | Beverlywood-adj. | 1966 | 13 | $4,495,000 | $345,769 | $322 | 5.24% | May 2025 |
| 3. 650 S La Jolla Ave | Beverly Grove · 90048 | 1928 | 12 | $4,300,000 | $358,333 | $352 | 5.41% | Mar 2025 |
| 4. 1036 S Wooster St | Beverlywood | 1965 | 5 | $2,100,000 | $420,000 | $343 | — | Dec 2025 |
| 5. 1111 S Holt Ave | Pico-Robertson | 1953 | 6 | $1,785,000 | $297,500 | $386 | 5.04% | Dec 2025 |
| 6. 919 S Sherbourne Dr | Pico-Robertson | 1958 | 5 | $2,240,000 | $448,000 | $390 | 4.96% | Nov 2025 |
| 7. 1026 S Shenandoah St | Beverlywood | 1954 | 6 | $2,152,000 | $358,666 | $407 | 5.02% | Oct 2025 |
| 8. 828 S Holt Ave | Pico-Robertson | 1964 | 5 | $2,034,000 | $406,800 | $365 | — | Mar 2026 |
| Average (7 sold comps, #2–8) | $2,729,429 | $376,438 | $366 | 5.13% | — | |||
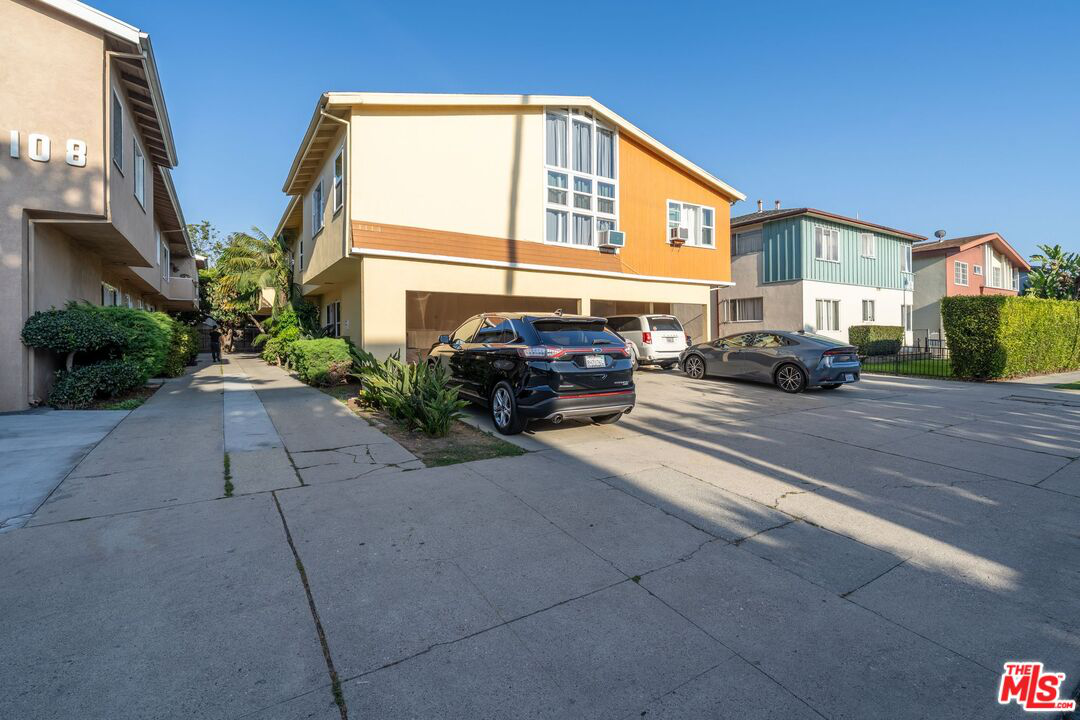
1. 1010 S Bedford St — SOLD by the LAAA Team (just closed). Our own Marcus & Millichap closing and the single most relevant trade in the submarket: a 1963-built, elevator-served 12-unit Pico-Robertson building sold for $3,650,000 ($304,167/unit, $283/SF, 5.16% cap). The campaign generated over 15 property tours and 6 written offers across a disciplined four-month, ~10-buyer process (listed $3,900,000, reduced to $3,800,000 then $3,725,000), and closed all-cash in a seven-day escrow to meet a buyer's 1031 exchange deadline — direct, first-hand evidence of live demand and pricing in this exact pocket.
6. 919 S Sherbourne Dr — The most location-relevant comp: a 1958 5-unit on the subject's own street, sold Nov 2025 at $2,240,000 ($448,000/unit, $390/SF, 4.96% cap). Its tight cap and high per-unit basis on a smaller building underscore the strength of the immediate Sherbourne rental pocket.
2–3. 1110 S Oakhurst Dr & 650 S La Jolla Ave — The two larger 12–13 unit trades ($345,769 and $358,333/unit at 5.24% and 5.41% caps) frame the going-in yield band for institutional-scale RSO product in the pocket.
4, 5, 7, 8. Wooster, Holt & Shenandoah — The cluster of 5–6 unit 1953–65 walk-ups ($297,500–$420,000/unit; 5.02%–5.04% caps where reported) brackets the subject's size and vintage most closely and anchors the $/SF range ($343–$407).
Averages exclude the featured 1010 S Bedford sale and are computed on the seven sold comps (#2–8). Cap rates shown where reported by the closing file.

| Address | Submarket | Yr | Units | List Price | $/Unit | Cap | Status |
|---|---|---|---|---|---|---|---|
| 1. 1017 S Shenandoah St | Pico-Robertson | 1955 | 6 | $1,995,000 | $332,500 | 5.76% | Active |
| 2. 1023 S Bedford St | Beverlywood-adj. | 1955 | 6 | $1,695,000 | $282,500 | 5.02% | Active |
| 3. 1526 S Wooster St | Beverlywood | 1958 | 5 | $2,695,000 | $539,000 | 4.42% | Active |
| 4. 6082 W 18th St | Faircrest / Mid-City | 2023 | 6 | $3,995,000 | $665,833 | 5.72% | Active |
| 5. 1135 S Corning St | Beverlywood-adj. | 1938 | 4 | $1,495,000 | $373,750 | 3.06% | Active |
| 6. 8616 Gregory Way | Pico-Robertson | 1960 | 5 | $2,299,000 | $459,800 | 3.30% | Active |
| Average (6 active comps) | $2,362,333 | $442,230 | 4.55% | — | |||
The most directly comparable active listing is 1017 S Shenandoah St — a 1955-built, 6-unit Pico-Robertson RSO building asking $1,995,000 ($332,500/unit) at a 5.76% cap. It is the pricing-ceiling reference for unrenovated vintage RSO product; the subject commands a premium above it for its recent roof, exterior paint, and four renovated interiors, plus a larger seven-unit count. The higher per-unit actives (Wooster at $539K/unit, Gregory Way at $460K/unit, and the 2023 new-construction W 18th at $666K/unit) reflect smaller buildings, boutique/new-build positioning, and lower going-in caps — showing that buyers in this pocket routinely pay up for quality and location. Against this active band, the subject's $2,295,000 / $327,857 per unit is positioned to clear inside the market rather than sit — a contrast to the prior listing of this same asset, which was canceled at $2,398,000 after only 22 days without a full mark-to-market and two-firm marketing platform behind it.
Source: Chase Commercial Term Lending rent roll dated 6/15/2026. Market rents per MLS #26831037 projected rents.
| Unit | Type | SF | Current Rent/Mo | Rent/SF | Market Rent/Mo | Status / Notes |
|---|---|---|---|---|---|---|
| 1 | 1BR / 1BA | 650 | $1,540 | $2.37 | $2,550 | Occ. since 2012 · below-market RSO |
| 2 | 1BR / 1BA | 850 | $1,205 | $1.42 | $2,550 | Long-term occ. · below-market RSO |
| 3 | 2BR / 1.5BA | 960 | $3,100 | $3.23 | $3,200 | Vacant · asking (renovated) |
| 4 | 2BR / 1BA | 940 | $3,068 | $3.26 | $3,200 | Leased 6/2026 · renovated |
| 5 | 1BR / 1BA | 850 | $2,395 | $2.82 | $2,550 | Leased 5/2026 · renovated |
| 6 | 1BR / 1BA | 850 | $2,395 | $2.82 | $2,550 | Leased 1/2026 · renovated |
| 7 | 1BR / 1.5BA | 960 | $2,030 | $2.11 | $3,200 | Occ. since 2015 · RSO |
| Total | 7 units | 6,060 | $15,733/mo | $2.60 | $19,800/mo | 85.7% occ. · +$48,804/yr upside |
Current GSR $188,796/yr • Market GSR $237,600/yr • plus ~$600/yr laundry income. Embedded mark-to-market upside ~26%.
| Income | Annual | Per Unit | $/SF | % EGI |
|---|---|---|---|---|
| Gross Scheduled Rent [1] | $188,796 | $26,971 | $30.07 | - |
| Other Income (Laundry) [2] | $600 | $86 | $0.10 | - |
| Less: Vacancy / Collection (3%) | ($5,664) | ($809) | $0.90 | - |
| Effective Gross Income | $183,732 | $26,247 | $29.27 | 100% |
| Expenses | Annual | Per Unit | $/SF | % EGI |
|---|---|---|---|---|
| Real Estate Taxes [3] | $28,688 | $4,098 | $4.57 | 15.6% |
| Insurance [4] | $5,843 | $835 | $0.93 | 3.2% |
| Water & Sewer [5] | $4,772 | $682 | $0.76 | 2.6% |
| Trash, Gas & Electric [5] | $6,959 | $994 | $1.11 | 3.8% |
| Repairs & Maintenance [6] | $8,400 | $1,200 | $1.34 | 4.6% |
| Gardening & Contract Services [7] | $1,200 | $171 | $0.19 | 0.7% |
| Management (4% of EGI) [8] | $7,349 | $1,050 | $1.17 | 4.0% |
| Licenses & RSO Fees [9] | $774 | $111 | $0.12 | 0.4% |
| Reserves ($250/unit) [10] | $1,750 | $250 | $0.28 | 1.0% |
| Total Operating Expenses | $65,735 | $9,391 | $10.47 | 35.8% |
| Net Operating Income | $117,997 | $16,857 | $18.80 | 64.2% |
[1] Gross Scheduled Rent: In-place scheduled rent per the Chase rent roll (6/15/26): $15,733/mo × 12. The vacant Unit 3 is carried at its $3,100 asking rate. Full market GSR of $237,600 is shown in the pricing pro forma.
[2] Other Income: Common laundry income per Chase operating history ($50/mo).
[3] Real Estate Taxes: LA County reassesses to purchase price at close; shown at 1.25% of the $2,295,000 list price. The seller's statements carry $0 taxes (low Prop-13 basis).
[4] Insurance: 2025 Chase actual ($5,843).
[5] Utilities: Water/sewer, trash, common gas & electric per 2025 Chase actuals; tenants pay in-unit electric/gas.
[6] Repairs & Maintenance: Normalized to ~$1,200/unit. New roof (2024) and 4 renovated interiors reduce forward turnover cost.
[7] Contract Services: Gardening (Chase actual) plus pest/quarterly service.
[8] Management: Market-normalized at 4% of EGI (seller self-managed; not in historical statements).
[9] Licenses & RSO Fees: LAHD/SCEP registration & city business tax per Chase actual.
[10] Reserves: $250/unit replacement reserve.
Seller's non-recurring legal/professional and unit-turn painting (2024–25) are excluded from stabilized NOI. Buyer to verify all actuals in due diligence.
| Operating Data | |
|---|---|
| Price | $2,295,000 |
| Down Payment (40.5%) | $928,345 |
| Number of Units | 7 |
| Price / Unit | $327,857 |
| Price / SF | $366 |
| Gross SF | 6,278 |
| Year Built | 1955 |
| Returns | |
|---|---|
| Cap Rate (in-place) | 5.14% |
| Cap Rate (pro forma) | 7.12% |
| GRM (in-place) | 12.16x |
| GRM (pro forma) | 9.66x |
| Cash-on-Cash | 2.12% |
| DSCR | 1.20x |
| Financing (Illustrative) | |
|---|---|
| Loan Amount | $1,366,655 |
| Rate / Amort | 6.00% / 30yr |
| Loan Constant | 7.19% |
| LTV (actual) | 59.5% |
| Constraint | DCR (1.20x) |
| Income (In-Place) | |
|---|---|
| Gross Scheduled Rent | $188,796 |
| Other Income | $600 |
| Less Vacancy (3%) | ($5,664) |
| Effective Gross Income | $183,732 |
| Operating Expenses | ($65,735) |
| Net Operating Income | $117,997 |
| Cash Flow (Yr 1) | |
|---|---|
| Net Operating Income | $117,997 |
| Debt Service | ($98,331) |
| Net Cash Flow | $19,666 |
| Cash-on-Cash | 2.12% |
| + Principal Reduction | $16,783 |
| Total Return | 3.93% |
| Pro Forma (Market Rents) | |
|---|---|
| Market GSR | $237,600 |
| Pro Forma NOI | $163,443 |
| Pro Forma Cap | 7.12% |
| Purchase Price | In-Place Cap | Cash-on-Cash | $/Unit | $/SF | GRM | DSCR |
|---|---|---|---|---|---|---|
| $2,545,000 | 4.51% | 1.58% | $363,571 | $405 | 13.48x | 1.20x |
| $2,495,000 | 4.63% | 1.66% | $356,429 | $397 | 13.22x | 1.20x |
| $2,445,000 | 4.75% | 1.76% | $349,286 | $389 | 12.95x | 1.20x |
| $2,395,000 | 4.87% | 1.87% | $342,143 | $381 | 12.69x | 1.20x |
| $2,345,000 | 5.01% | 1.98% | $335,000 | $374 | 12.42x | 1.20x |
| $2,295,000 | 5.14% | 2.12% | $327,857 | $366 | 12.16x | 1.20x |
| $2,245,000 | 5.28% | 2.42% | $320,714 | $358 | 11.89x | 1.22x |
| $2,195,000 | 5.43% | 2.79% | $313,571 | $350 | 11.63x | 1.26x |
| $2,145,000 | 5.59% | 3.18% | $306,429 | $342 | 11.36x | 1.29x |
| $2,095,000 | 5.75% | 3.59% | $299,286 | $334 | 11.10x | 1.33x |
| $2,045,000 | 5.92% | 4.01% | $292,143 | $326 | 10.83x | 1.37x |
The suggested list price of $2,295,000 reflects a 5.14% in-place cap rate — a disciplined, buyer-credible going-in yield the LAAA Team just proved out in this exact submarket. Our own just-closed sale of 1010 S Bedford St (12-unit, 1963, Pico-Robertson) traded at a 5.16% cap, and the seven vetted Pico-Robertson / Beverlywood sold comps average a 5.13% cap; against that evidence $2,295,000 is well-supported for a smaller, recently-recapitalized asset carrying a clear mark-to-market path to a 7.1% cap at stabilization.
On a per-unit basis ($327,857/unit), the price sits meaningfully below the seven-comp sold average of $376,438/unit — including 919 S Sherbourne Dr, on the subject's own street, at $448,000/unit — leaving room for a buyer while defending the seller's number. On price-per-SF ($366/SF) the subject prices right at the comp-set average of $366/SF, and on cap rate (5.14%) it is in line with the 5.13% sold-comp average. The prior listing of this same asset was canceled at $2,398,000 after only 22 days; re-presented at a market-clearing 5.14% in-place cap with a full mark-to-market and a two-firm marketing platform, $2,295,000 is built to sell within a 60–90 day window.